Difference between revisions of "COVID-19"
(→Resources) |
(→Resources) |
||
| Line 32: | Line 32: | ||
| style="width: 33%;border:none;"| | | style="width: 33%;border:none;"| | ||
| + | [https://www.arcgis.com/apps/opsdashboard/index.html#/bda7594740fd40299423467b48e9ecf6 Center for Systems Science and Engineering (CSSE) at Johns Hopkins University (JHU)] | ||
| + | |||
| + | [[File:Covid-2.png]] | ||
| + | |||
| style="width: 33%;border:none;"| | | style="width: 33%;border:none;"| | ||
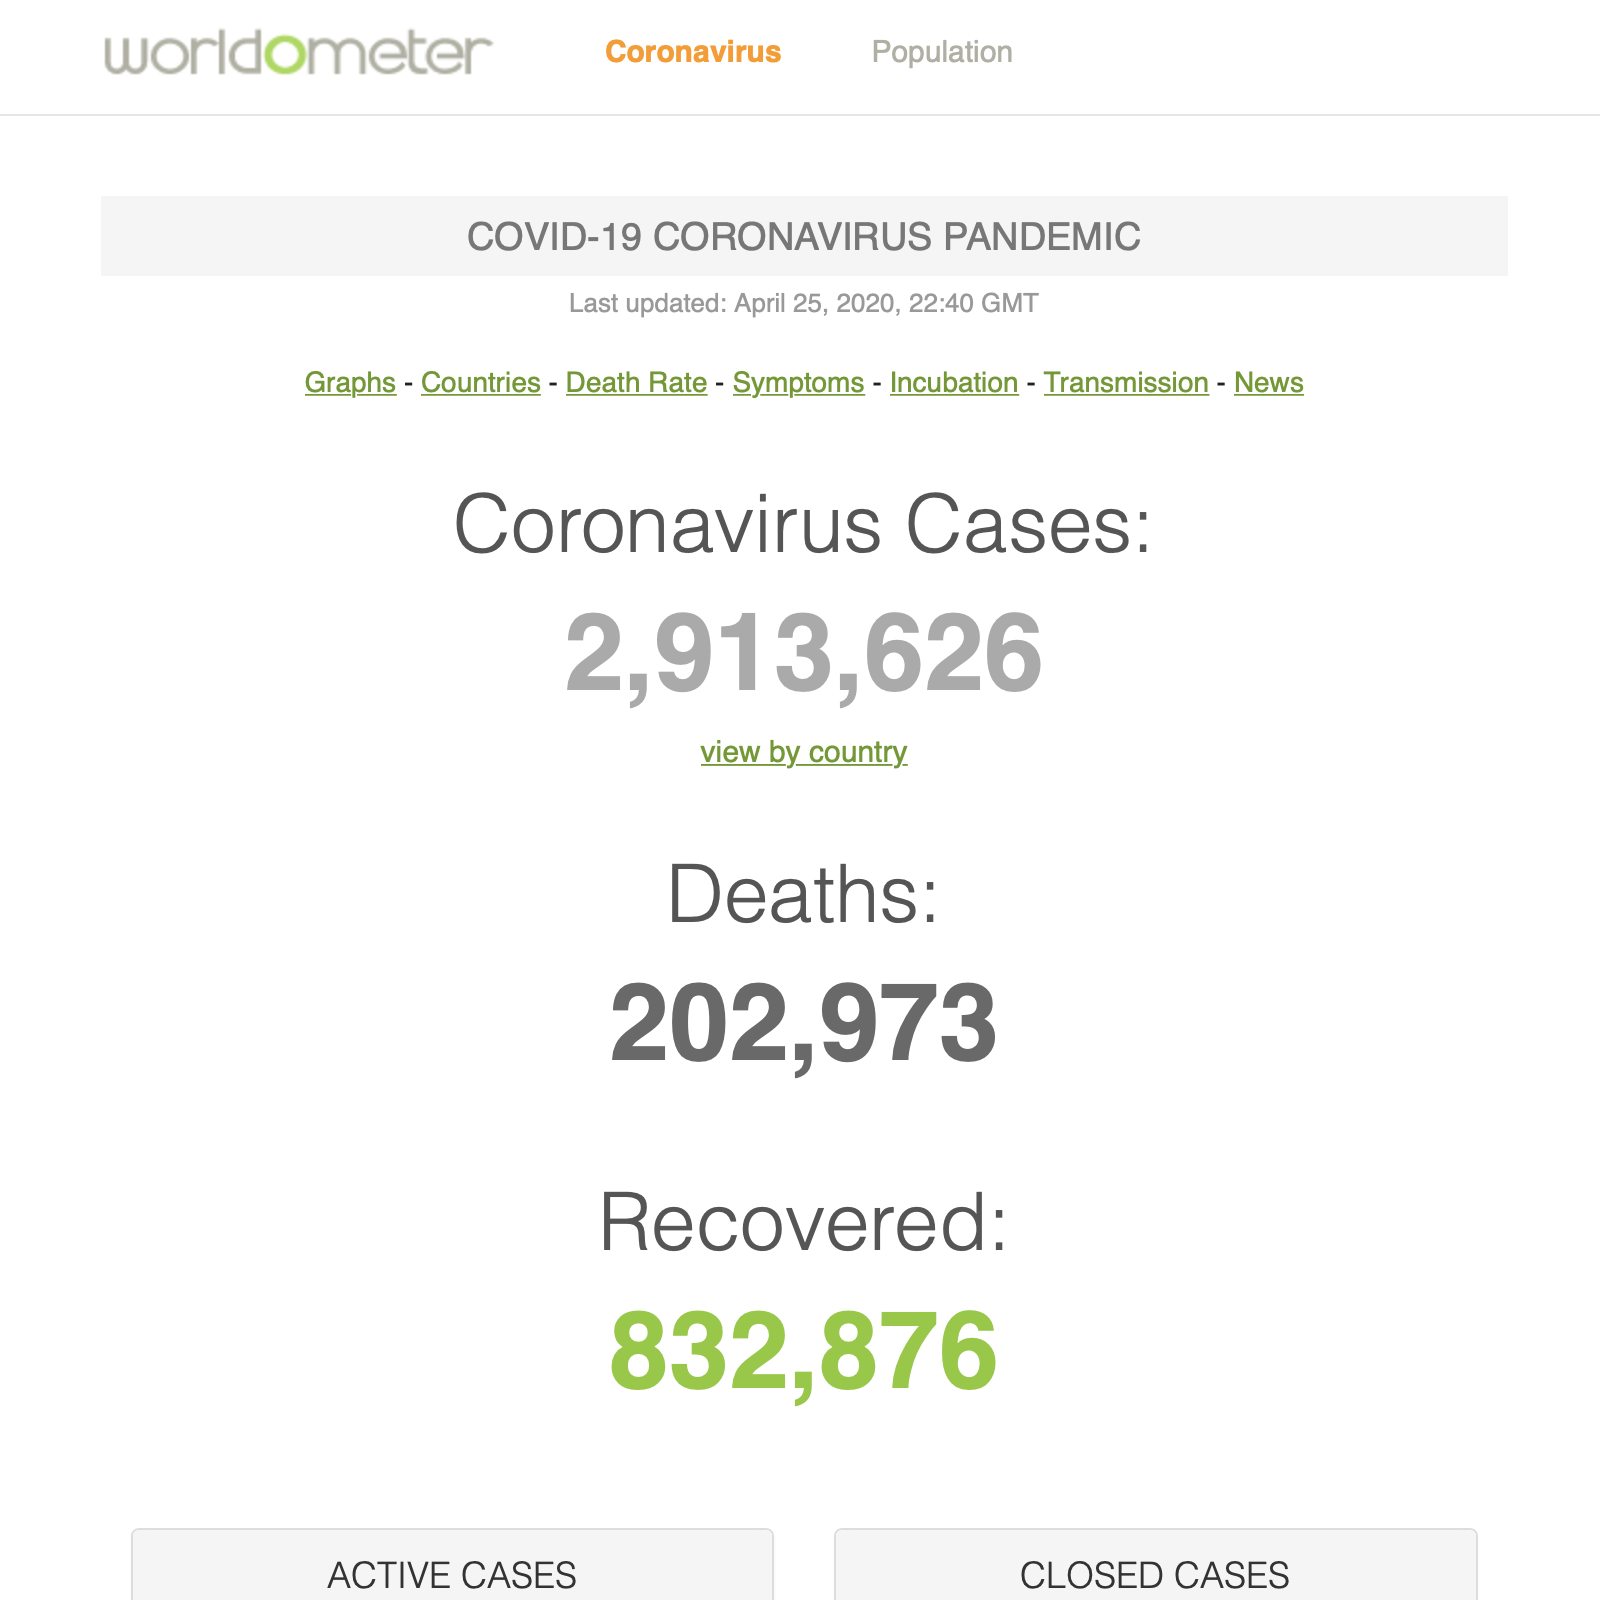
| + | [https://www.worldometers.info/coronavirus/ Worldometers] | ||
| + | |||
| + | [[File:Covid-3.png]] | ||
| + | |||
|- | |- | ||
| − | | style="border:none;" | [https:// | + | | style="border:none;" | |
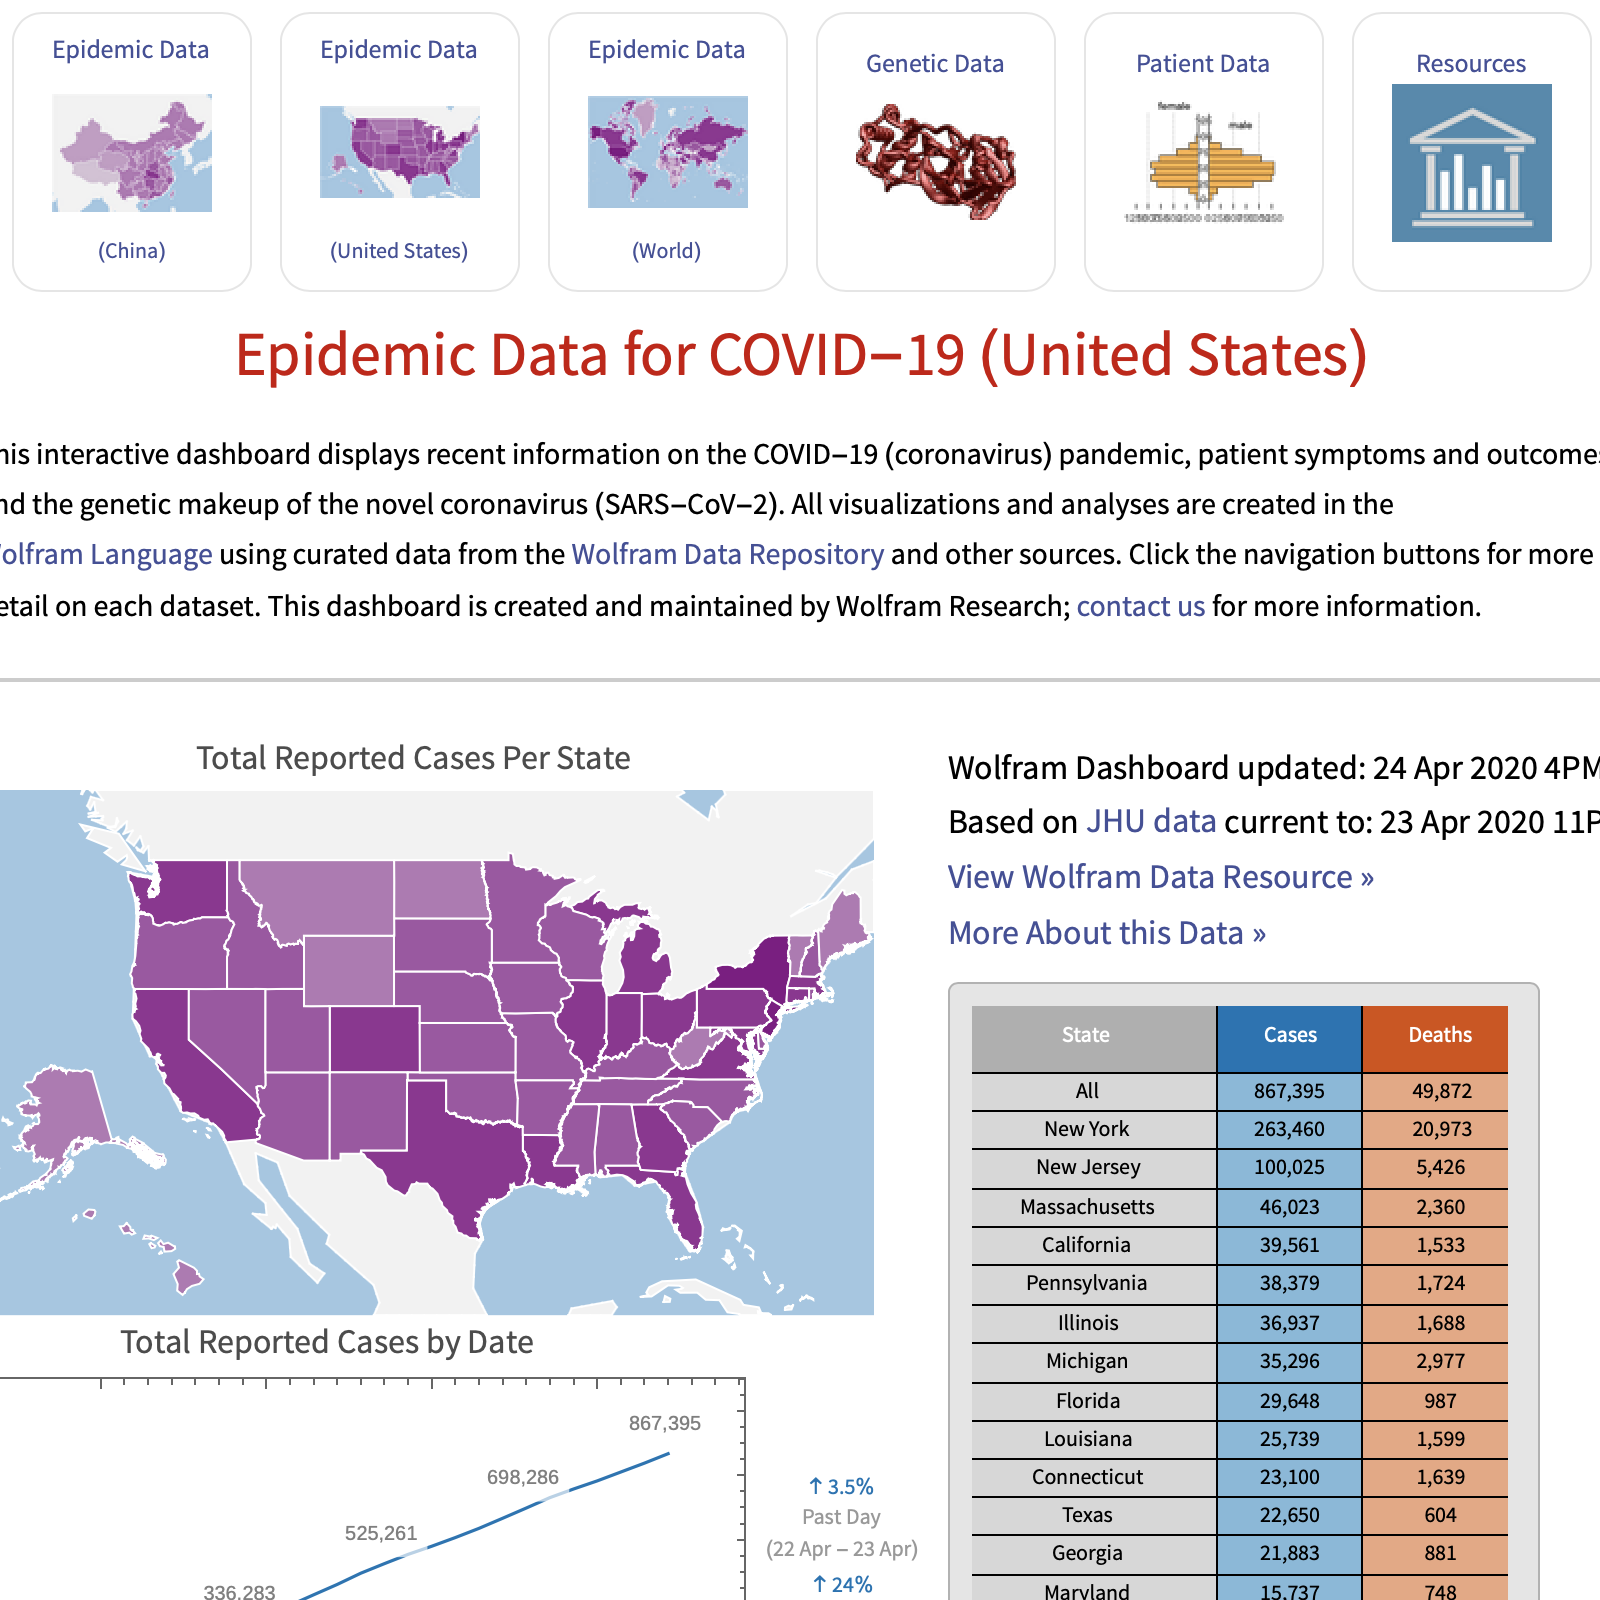
| − | + | [https://wolfr.am/COVID19Dashboard Wolfram] | |
| − | + | ||
| − | + | [[File:Covid-4.png]] | |
| − | + | ||
| − | + | | style="border:none;" | | |
| − | + | | style="border:none;" | | |
| − | |||
| − | | style="border:none;" | | ||
| − | | style="border:none;" | ||
| − | | | ||
|} | |} | ||
Revision as of 10:55, 29 April 2020
SARS-CoV-2, The Virus
- Inside the Coronavirus Genome by J. Corum and C. Zimmer, April 3, 2020 — NY Times
Updates
- Outbreak Updates (Government of Canada)
- Coronavirus disease (COVID-19): Awareness resources (Government of Canada)
- Google Database Search
- The Centers for Disease Control and Prevention (CDC)
- Real-time estimation of the novel coronavirus incubation time
- The crystal structure of COVID-19
- Our World in Data
- The Coronavirus Outbreak — NY Times
- Flatten
- R Epidemics Consortium
- Our World of Data
Resources
|
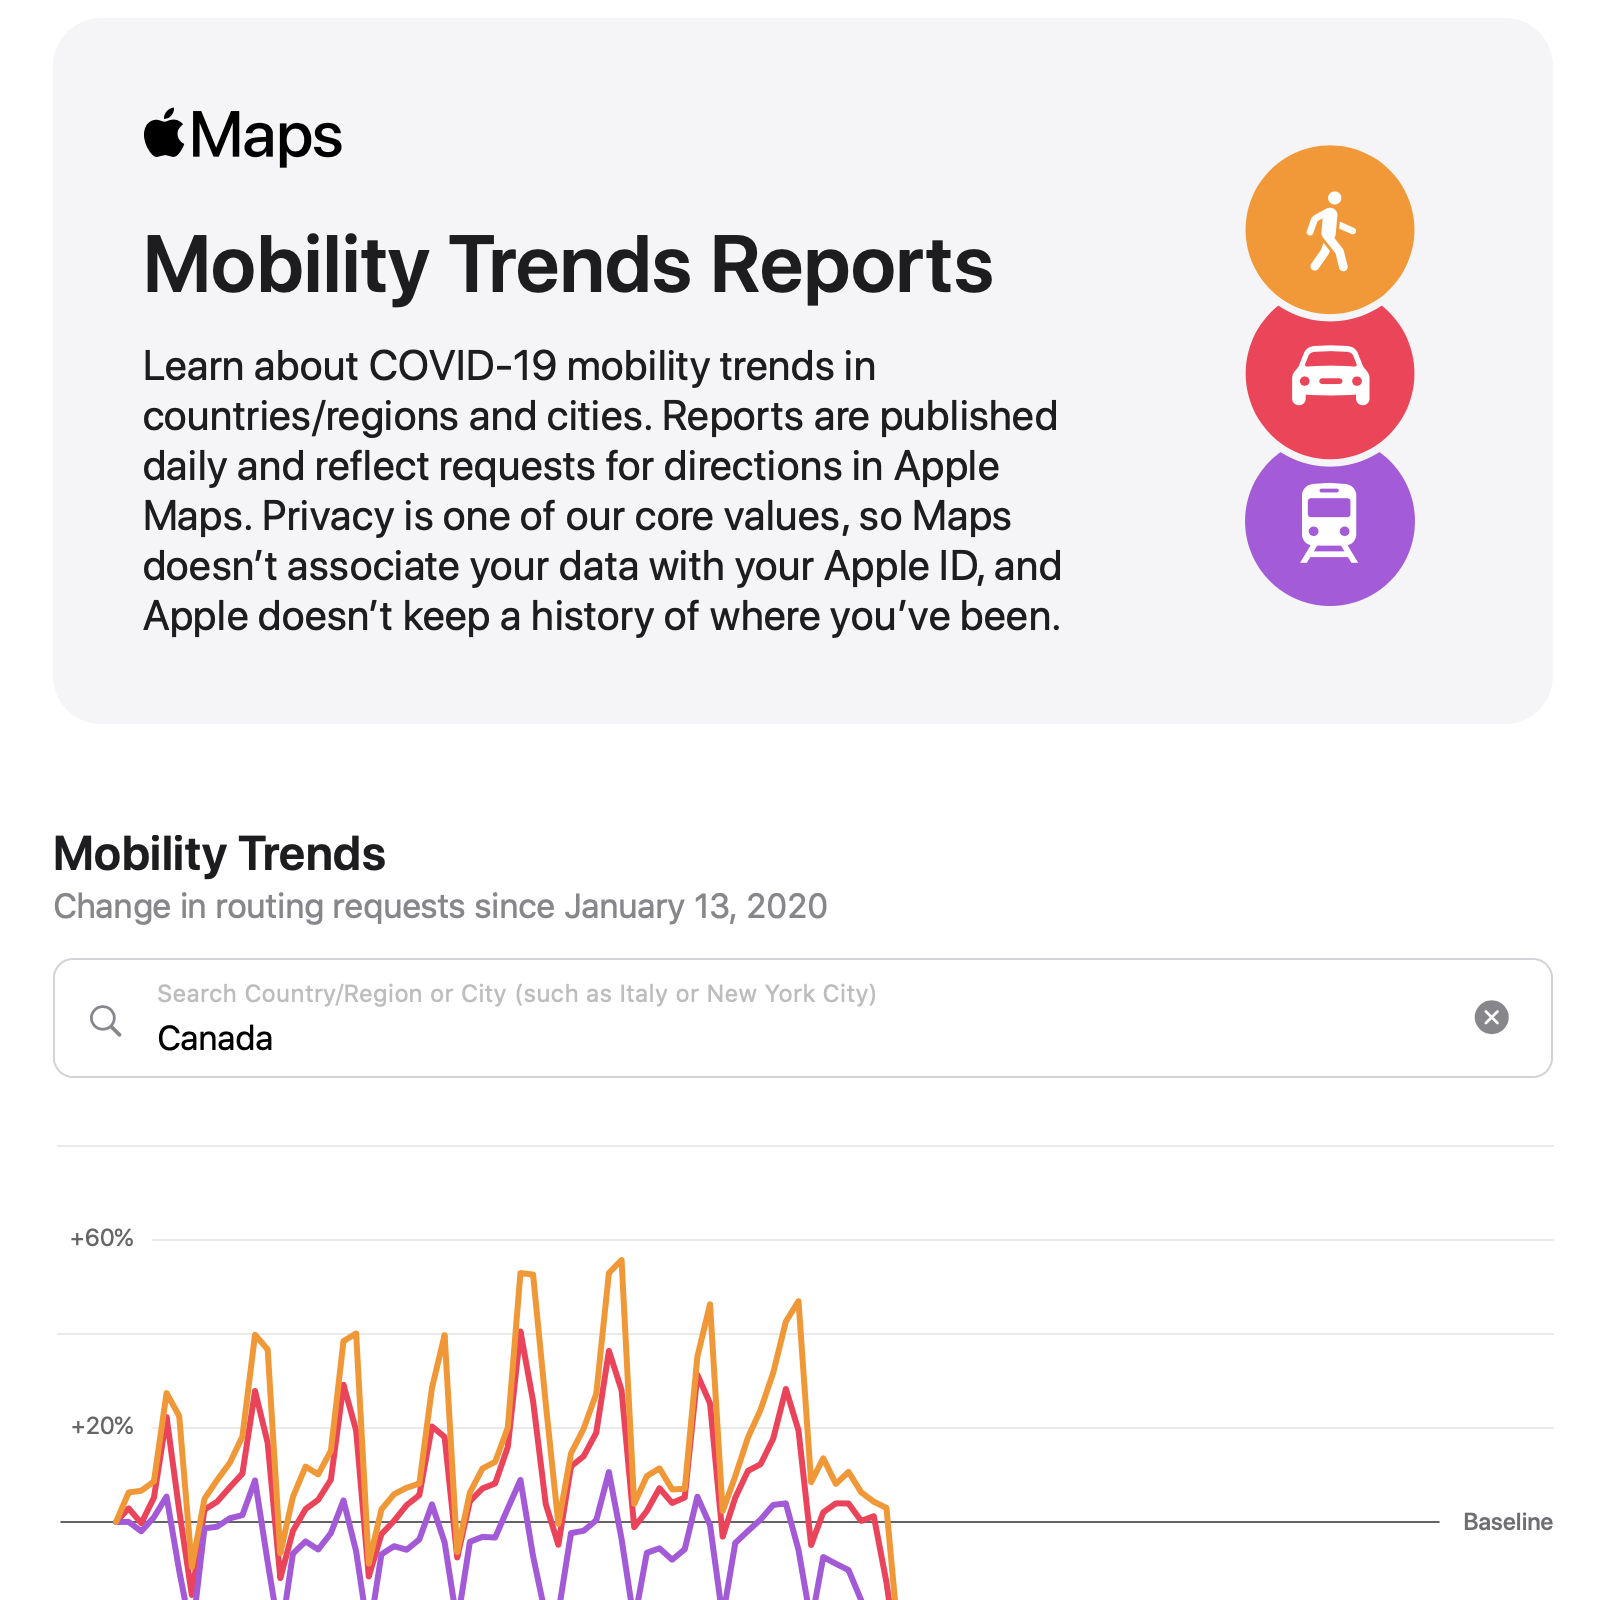
Learn about COVID‑19 mobility trends in countries/regions and cities. Reports are published daily and reflect requests for directions in Apple Maps. |
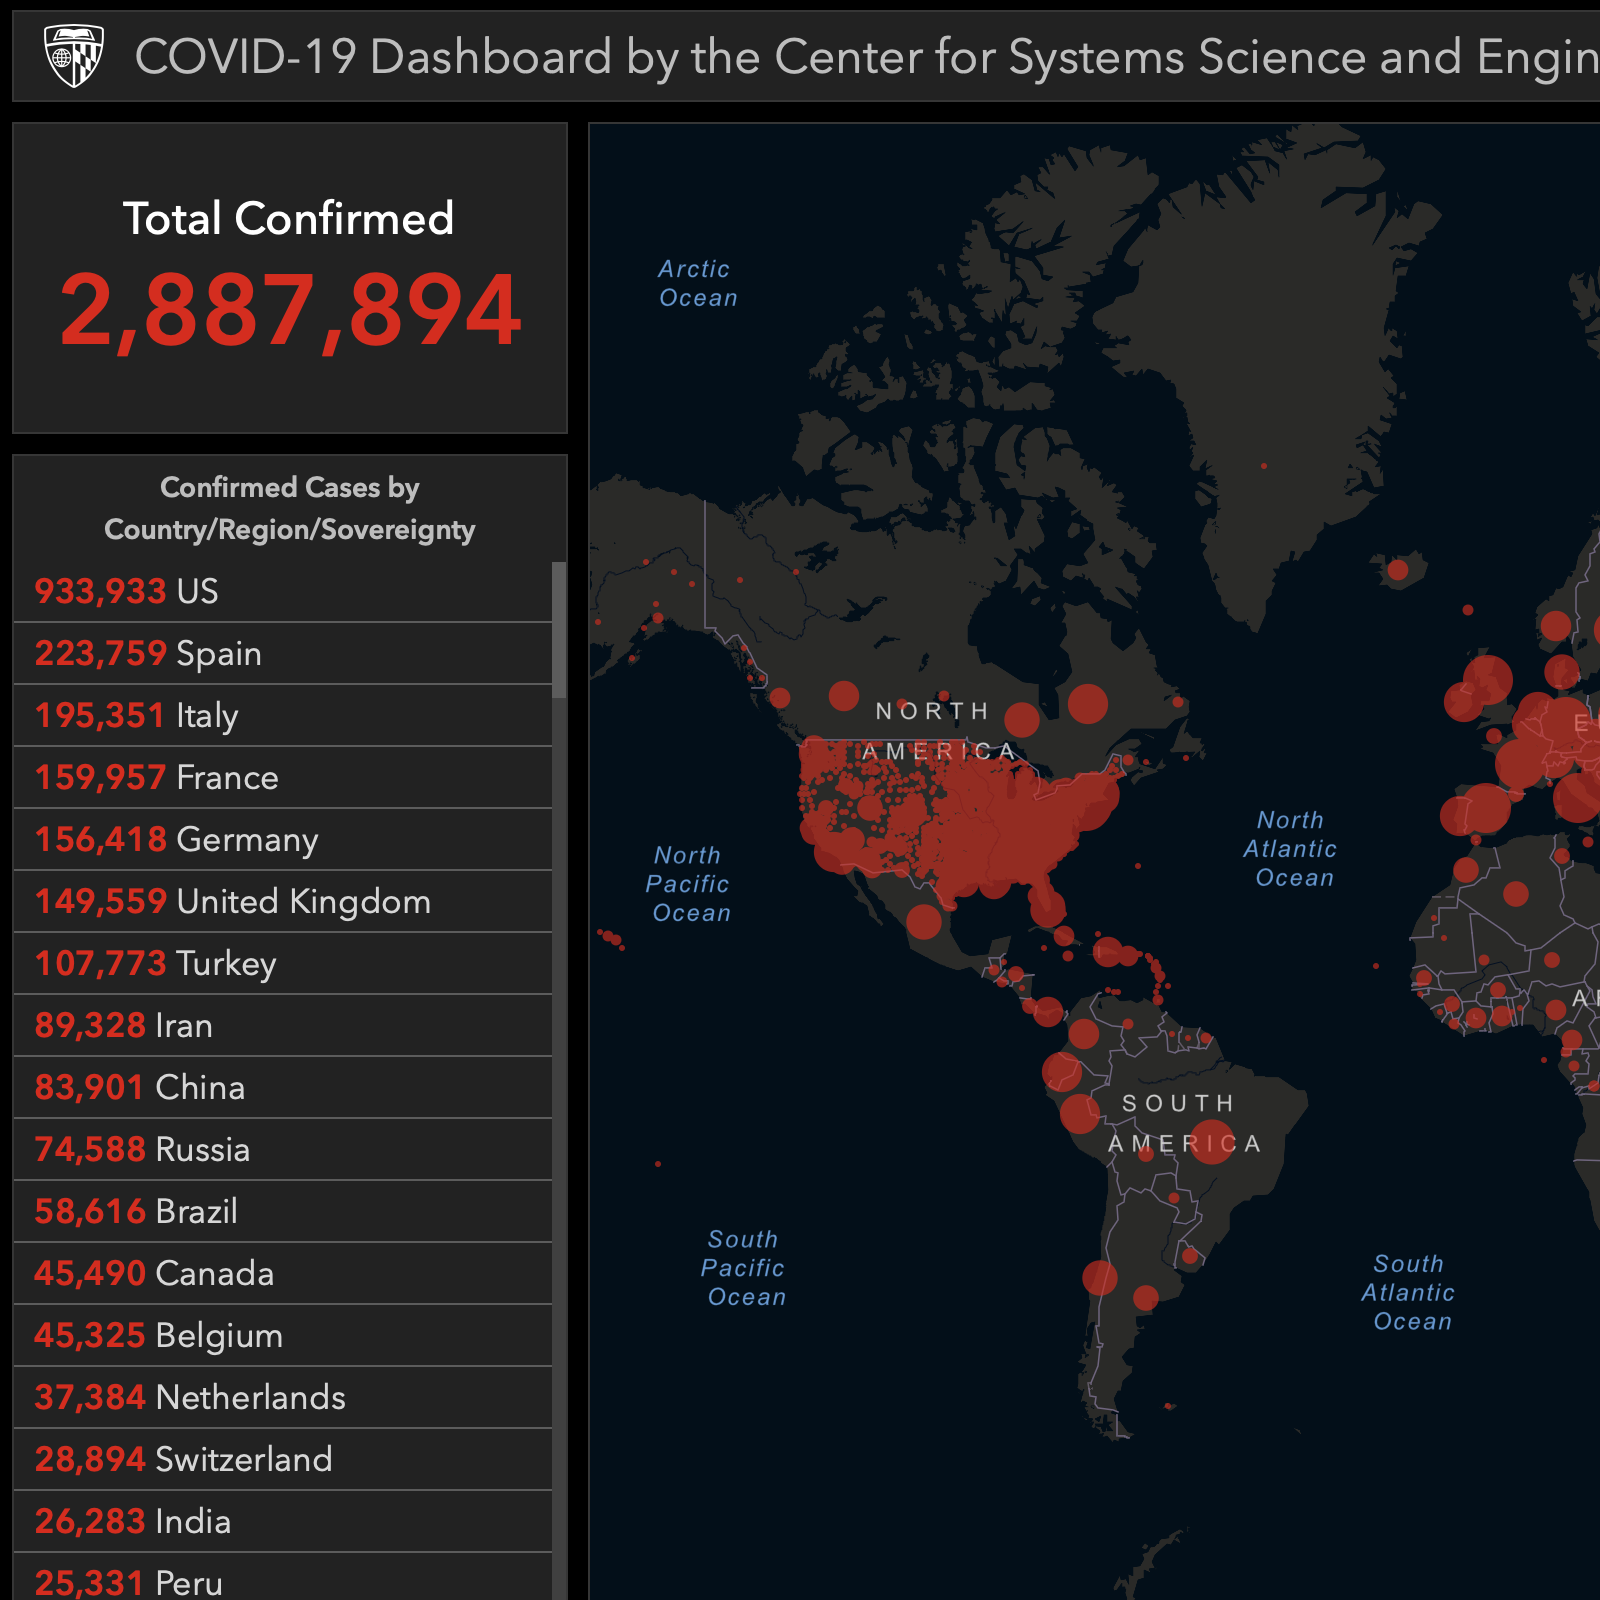
Center for Systems Science and Engineering (CSSE) at Johns Hopkins University (JHU) |
|
Observable
- Observable Collection
- Fatality Rate and Spreading Trends by Y. Ahn
- EPi Curve by Niraj D
Shiny
- CoronaTacker by A. C. Valdez
- A Dashboard by C. Schoenenberger
- Modeling Spread and Capacity by A. Hill et al.
- Flatten the Curve by M. Höhle
- Explore the Spread by J. Gassen
Tableau
- Genomic epidemiology of novel coronavirus (hCoV-19)
- DXY
- COVID-19 Scenarios
- Hospital Impact Model for Epidemics (CHIME)
- IHME COVID-19 Projections
- EpiRisk
- Infodemics Observatory
- 10 Day Forecast — University of Melbourne
Research
- Outbreak by K. Simler
- COVID-19 Open Research Dataset (CORD-19)
- CORD-19 Research Challenge (Kaggle)
- Contagiousness of COVID-19 Part I: Improvements of Mathematical Fitting by M. Weterings


